Weather maps are a fundamental part of weather forecasting and meteorology. This article is an introduction to the fundamentals of meteorology and their depiction on weather maps.
You will learn how to read a weather map and what the different symbols mean.
How to read a weather map
Air Pressure
Air pressure is one of the most fundamental quantities used in the study of weather forecasting. As the name suggests, air pressure denotes how much pressure the column of air above a certain location exerts on the earth’s surface. About 75% of the Earth’s air is stored in the troposphere, which is the lowest layer of the atmosphere. The higher you go, the less air there will be. For example, the air pressure at the top of Mount Everest is about three times lower than at sea level. On weather maps, the pressure is always recalculated to the air pressure at sea level to be able to study the regional differences in air pressure better.
The air pressure is denoted in hPa (hectopascals, 1hPa=100Pa). The average air pressure of the Earth at sea level is 1013hPa. However, due to the tilt and curvature of the Earth, some regions receive more energy from the sun than others. These regions experience higher temperatures, and when the air warms up, it ascents up in the troposphere. In this manner, a lower pressure is created at the surface. Temperature differentials are the main reason for pressure differences between different regions. And it is these pressure differences that lay at the base of weather forecasting.
Low and High-Pressure Areas
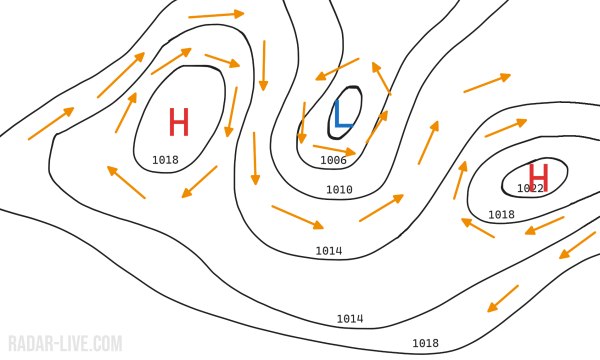
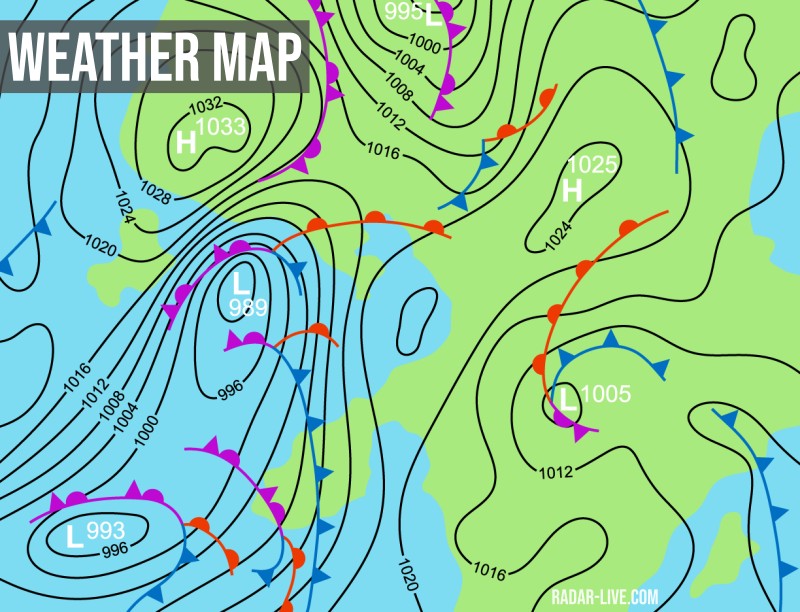
Low and high-pressure systems or areas are relative measures, this means that there is no specific air pressure for which a pressure is seen as low or high. A low-pressure area (synonyms: low, depression, cyclone) is an area of lower pressure than its surroundings. A high-pressure system (synonyms: high, anticyclone) is defined oppositely. To identify lows and highs on a weather map, isobars are used. An isobar is a line that connects points with an equal sea-level air pressure. These lines are labelled with their corresponding pressure value (in hPa). The higher this value, the higher the pressure. An air pressure map is comparable to a topographic map, where mountain peaks are high-pressure areas (local maxima), and valleys are lows (local minima). The lows are often marked with an L, while the highs are marked with an H.

Wind around Highs and Lows
Nature always tries to be as stable as possible. In the case of pressure areas that means that nature tries to equalise variations in pressure by moving air from one place to another. That’s why the air would move from high-pressure areas to areas with lower pressure, under the assumption that the Earth would not be spinning. But the Earth is spinning. This means that the movement of air from highs to lows is redirected.
In the Northern Hemisphere, the movement of air, also known as wind around a low is counter-clockwise, while the wind moves in a (nearly) clockwise fashion around an anticyclone. In the Southern Hemisphere, this motion is inverted. The direction of the wind can thus be determined on a weather map by finding the areas of low and high pressure and following the isobars respectively in an anticlockwise or clockwise direction.

Air Masses
We’ve learned that lows and highs result in air movements. But not all air masses are identical. The temperature for a given location is greatly influenced by the direction of the wind, and the resulting air mass. Air masses are classified using two criteria: their temperature and their origin. Polar air masses are cold, while tropical air masses are warmer. The two origin types are maritime, when the air mass moves over a big stretch of open water, like a sea or ocean. The other type is continental when the air mass does not move across a significant body of water.
Wind direction often doesn’t tell the whole story, the origin of the air is more important. For example: in Western Europe, a northwestern wind often results in a maritime polar air mass (mP). Maritime air masses result in less extreme temperatures and more moisture in most cases. In the Northeast of the USA for example, a northwestern wind would result in a continental polar air mass (cP), resulting in lower temperatures than in Western Europe, even though the wind direction might be identical.
Boundaries between Air Masses: Fronts
A weather front is the boundary between air masses of different types. Depending on the air masses in front of, and behind the boundary, the front type is determined. There are three main types of fronts:
Cold front: the boundary between colder and warmer air, where the colder air mass is replacing the warmer air mass. Cold fronts are denoted by a blue line with triangles on weather maps, the direction of triangles is the direction of movement. Cold fronts are often formed up of (thunder)storms with heavy precipitation in some cases. During the passage of the front, the temperature at ground level will quickly drop.

Warm front: just like cold fronts, this is the boundary between warm and colder air. In this case, though, the cold air mass is replaced by the warm one. Warm fronts show up as red lines with half circles in the direction of movement on weather maps. Unlike cold fronts, precipitation on warm fronts tends to be less severe, but with a longer duration. At the surface level, the temperature slowly rises, as opposed to the rather abrupt temperature change with cold fronts.

Occluded front: cold fronts move quicker than warm fronts, when a cold front overtakes a warm front, an occluded front is formed. This is denoted by a purple line with triangles and half circles in the direction of movement. Occluded fronts tend to be quite similar to cold fronts but with a less severe temperature drop.

Surface Weather Observations
The last main element present on a weather map is the surface observations. These are spread out over the map. These observations depict a variety of meteorological parameters, including the important ones like air pressure, temperature, wind and weather.

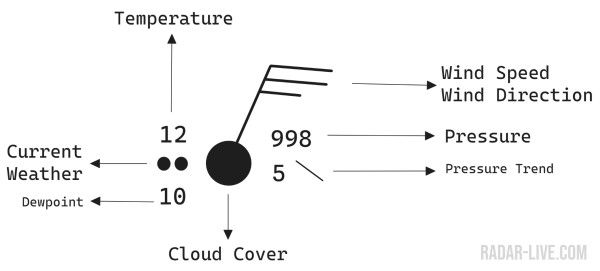
A simple version of such a weather observation point is given above. There is a lot of information in a rather small space. The big circle in the middle represents the cloud cover, if the circle is completely filled (like in the example), it means that 100% of the sky is filled with clouds. The less the circle is filled, the fewer clouds present in the sky. The wind barb is directed in the direction of the wind (so in the example the wind direction is north-northeast). The number and size of ticks on the barb represent the wind speed.
The number in the upper left is the air pressure or at least a part of it. The three numbers visible are the last three numbers of the air pressure in hPa (or mbar) if noted down with one number after the decimal point. So in this example 998 translates to X99.8hPa, the X could be either 9 or 10, but since air pressure is almost always in the range (950-1050): X is 10 if the value is below 500 and 9 if it is above. The pressure trend is the change in air pressure over the last 3 hours, the line denotes the direction of the change. So in the example, the air pressure decreased by 0.5hPa over the past 3h.
The value in the upper left is the temperature in °C (or °F in the USA). The value below is the dewpoint in °C(°F). The relative humidity of the air can be determined using this value. The closer the dewpoint is to the temperature, the higher the relative humidity. In between these two values, there is space for an icon describing the current weather.
Present Weather Symbols
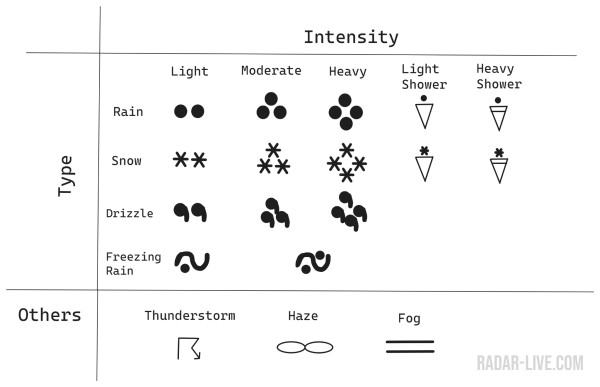
There are over one hundred unique weather symbols. We will take a look at the most important ones in this section. Most present (or current) weather symbols relate to precipitation. There are a couple of different symbols for precipitation type: one for rain, snow, drizzle and freezing rain. These symbols change when the intensity of the precipitation changes. In the example above, the weather observation is light rain (two circles).

Then there are also symbols for (rain or snow) showers, thunderstorms, haze and fog. Many of these symbols can also be combined to be able to deliver even more information. There are over ten symbols to describe thunderstorms for example. The symbols in the table above are the most important and most used.
Conclusion
Weather maps contain a load of information. From isobars which denote lows and highs to fronts and weather symbols, which contain a lot of information themselves. We can derive the most important meteorological parameters from a weather map: air pressure and its relation to wind direction, fronts which are the boundaries between air masses and weather observations which can tell us more about the actual weather at the surface level: temperature, exact air pressure, wind speed and direction and the present weather. Now you should be able to understand all main aspects of a modern weather map and derive conclusions about the weather in different locations using weather maps.
